Showing posts with label CCCTAA. Show all posts
Showing posts with label CCCTAA. Show all posts
Wednesday, February 10, 2016

Monday, March 19, 2012
Genomic head to head telomeric sequences detection by one primer PCR
Introduction
Dicentric chromosomes are the signature of recombination events which may imply telomeric motifs. To observe dicentric chromosomes in senescent cells, a cell culture followed by an enrichment step is performed to get enough metaphasic cells. However metaphasic cells become difficult to get as the cell culture reaches senescence or if cells differenciate, thus most of fusions between short telomeres, when they occur, remain hidden in interphasic cells.
Telomeric fusions can generate head to head TTAGGG motifs as:
(TTAGGG)n(CCCTAA)m
 |
| Head to head telomeric sequences (blue) at a fusion point (several possibilities), flanked by proximal (orange, green) and distal (purple) subtelomeric sequences. |
Such kind of sequence is known in the human genome at the 2q13-q14 locus (Ijdo et al.).
>gi|180516|gb|M73018.1|HUMCHR2A Human ancestral telomeric fusion DNA sequence
GTGCCCCGGCGCCACGAGGGCGCTGGCGACCACTGTAAGCAAGAGAGCCCTGCGCCTCTCTGCGCCTGCG
CGGCCGGGCCGGCCGGCCGCCTTTGCGATGGCGGAGTTGCGTTCTCCTCAGCACAGACCCGGAGAGCACC
GCAGGGCGACCTGCGTTGTCTCTGCACAGATTTCGGTGGTACTGCGAAGGCGGACGAGAGTTCTCCTCAG
GTCAGACCCGGGCCGGGCCGGCTAGGATACCGCGAGGCGAGCTGCGTTCTGCTCAGCACAGACCTGGGGG
TCACCGTAAAGATGGAGCAGCATTCCCCTAAGCACAGAGGTTGGGGCCACTGCCTGGCTTTGTGACAACT
CGGGGCGCATCAACGGTGAATAAAATCTTTCCCGGTTGCAGCCGTGAATAATCAAGGTCAGAGACCAGTT
AGAGCGGTTCAGTGCGGAAAACGGGAAAGAAAAAGCCCCTCTGAATCCTGGGCAGCGAGATTATCCCAAA
GCAAGGCGAGGGGCTGCATTGCAGGGTGAGGGTGAGGGTGAGGGTGAGGGTTAGGGTTTGGGTTGGGGTT
GGGGTTGGGGTTGGGGTAGGGTTGGGGTTTGGGTTGGGGTTAGGGTTAGGGGTAGGGGTAGGGTCAGGGT
CAGGGTCAGGGTTAGGGTTTTAGGGTTAGGGTTAGGGTTAAGGTTTGGGGTTGGGGTTGGGGTTGGGGTT
AGGGGTTAGGGGTTAGGGGTTAGGGTTGGGGTTGGGGGTTGGGGTTGGGGTTAGGGGTAGGGGTAGGGGT
AGGGTTAGGGTTAGGGTTAGGGTAAGGGTTAAGGGTTGGGGTTGGGGTTGGGGTTAGGGTTAGGGGTTAG
GGTTAGCTAACCCTAACCCTAACCCCTAACCCCTAACCCCAACCCAAACCCCAACCCCAACCCCAACCCT
ACCCCTACCCCTAACCCCAACCCTTAACCCTTAACCCTTAACCCTTACCCTAACCCTAACCCAAACCCTA
ACCCTAACCCTACCCTAACCCAACCCTAACCCTAACCCTACCCTAAGCCTAAAACCCTAAAACCGTGACC
CTGACCTTGACCCTGACCCTTAACCCTTAACCCTTAACCCTAACCCTAACCATAACCCTAAACCCTAACC
CTAAACCCTAACCCTACCCTAACCCCAACCCCTAACCCTAACCCCTATACCCTAACCCTAACCCTACCCC
TACCCCTAACCCCAACCCCAGCCCCAACCCCAACCCTTACCCTAACCCTACCTAACCCTTAACCCTAACC
CCTAACCCTAACCCCTAACCCTACCCCAACCCCAAACCCAACCCTAACCCAACCCTAACCCAACCCTAAC
CCCTACCCTAACCCCTAACCCTAACCCCTACCCTAACCCCTAACCCTAACCCCTACCCTAACCCCTAACC
CTAGCCCTAGCCCTAACCCTAACCCTCACCCTAACCCTCACCCTAACCCTCACCCTCACCCTCACCCTCA
CCCTAACCCAACGTCTGTGCTGAGAAGAATGCTCGTCCGCCTTTAAGGTGCCCCCCAGGTCTGTGCTGAA
CAGAACGCACGTCCGCCGTCGCAGTGCCCTCAGCCCGGGTCTGACCTGAGAAGAACTCTGCTCCGCCTTC
GCAATAGCCCCGAAGTCTGTGCAGAGGAGAACGCAGCTCCGCCCTCGCGATGCTCTTCGGCTGTGTGCTA
AAGAGAACGCAACTCCGCCCTCGCAAAGGCGGCGCCGCCGCGGAGGCCGGAGAGGCGCGGCGCCGCGGAG
GCCGGAGAGGCGCGGCGCGCGGGAGGCCGGAGAGGCGCGGCGCCGCGGAGGCCGGAGAGGCGCGGCGCCG
CGGAGGCCGGAGAGGCGCGGCGCCGCGGAGGCCGGAGAGGCGCGGCGCCGCGG
The fusion point of this sequence is:
It is the cicatrix of an ancestral chromosomic fusion occured during karyotype evolution. As the human 2q13-q14 contains a short amount of degenerated telomeric motifs these motifs are degenerated so they cannot be detected by QFISH with (CCCTAA)3 PNA probe (most of the time):
Using Polymerase Chain Reaction and only one (TTAGGG)n primer, would it be is possible to detect head-to-head genomic telomeric sequences possibly resulting from chromosomal fusion ?
..TTAGGGTTAGCTAACCCTAA..
 |
| Possible QFISH detection of telomeric motifs at 2q13-q14 on one HSA2 homolog. Interstitial telomeric motifs are detected at the junction of euchromatin/heterochromatin on the Y chromosome. (Red: telomeric (CCCTAA)3-PNA probe, contrast was increased after background substraction) |
Using Polymerase Chain Reaction and only one (TTAGGG)n primer, would it be is possible to detect head-to-head genomic telomeric sequences possibly resulting from chromosomal fusion ?

| Detection of a genomic head-to-head telomeric sequence by PCR amplification with one (TTAGGG)n primer (Dark Blue big arrow) |
Here was investigated the possibility to detect somatic telomeric fusion occurring in senescent or SV40-transformed fibroblasts by one primer PCR amplification of head-to-head telomeric sequences.(J-P Pommier, unpublished data)
It was found that PCR products ( next called G PCR products) can be produced from genomic human DNA with single TTAGGG primers. It is known that human genome DNA contains head-to-head telomeric motifs and possibly some were generated by chromosomal instability in cultured cells.
Material and method:
The cycle conditions of the first PCR assay were inspired by the paper of Ijdo et al. . As no PCR product was detected with these conditions, the stringency conditions were relaxed by decreasing the annealing temperature, without my lab-book, I cannot bring more precision on the cycling conditions.
Two kinds of assay were performed: G-PCR with (TTAGGG)n primers (n=3 or 5) or C-PCR with (CCCTAA)n primers (n=3 or 5) , both with 100ng of genomic DNA (high molecular weight placenta DNA, primary fibroblasts, SV40 transformed fibroblast pre-crisis/post-crisis, wild type S. cerevisiae genomic DNA was also tested). In a second assay, both G an C primers were used at high (100 nM?) or low (20 nM?) concentration. G3-primer and C3-primer had 5' non telomeric sequence allowing a second PCR round with a non telomeric primer.
In an assay, prior PCR, 1 microgramme of genomic DNA was digested by Hpa II (methylation sensitive) or Msp I restriction endonuclease (NEB) targeting GGCC or by an other endonuclease targeting a TTAA restriction site. A 100ng aliquot was then submitted to G-PCR.
PCR products were analysed in a 2-3% agarose gel electrophoresis, stained with ethidium bromide, with a molecular weight standard in the range 200 to 2000 bp approximatly (possibly molecular weight marker IV, Roche?).
Results:
Genomic DNA from placenta, primary fibroblasts, precrisis SV40 transformed fibroblasts submitted to G5-PCR (wells n°6,8,10) yield a smear like PCR product with possibly discrete bands. The same genomic DNA submitted to C5-PCR yield a smears as PCR product with no bands.
 |
| From left to right: Wells n°2, 13: molecular weight markers. Wells n°6, 8, 10: G5-PCR with (TTAGGG)5 primer. Wells n°7, 9, 11: C5-PCR with (CCCTAA)5 primer. Well n°12:?. The wells n°3, 4 may be some control (no primer, no genomic DNA). |
 ,
,
C5-PCR or C3-PCR yield a smear as PCR product at high concentration. The PCR product becomes undetectable at low primer concentration. I performed C5-PCR or C3-PCR as a control, I didn't expect to detect a PCR product with a (CCCTAA)n primer due to the head to head orientation of the telomeric motifs in a telomeric fusion. Queue-to-queue telomeric motifs may occur, but those PCR products are likely PCR artifacts.
More interestingly, G5-PCR and G3-PCR yield bands-like PCR products with human DNA in all conditions:
- Bands are observed with human DNA as PCR target, whereas a smear is observed with yeast DNA, indicating that the PCR product detect a specific structure in the human genome which is not present in the yeast genome.
- With the "eyes of faith" (les yeux de la foi), G5-PCR at hight concentration primer, seems to distinguish postcrisis DNA (well 8, upper) from normal or precrisis DNA (wells 6,7 upper) by an relative increase of the amount of the short band. As the SV40 transformed fibroblasts reach the crisis, the frequency of dicentric chromosomes increase and become stable when an immortal clone emerge from the crisis. It is consistent with an accumulation of head-to-head telomeric motif generated by chromosomal fusion between short telomeres.
- The shortest band (~600 bp) vanishes from the PCR product as the G5 primer concentration is diminished regardless the source of DNA (primary cells, precrisis or postcrisis cells). There are possibly several ancestral HTH telomeric motifs per cell, whereas there is less than one neo HTH telomeric motif per cell (statistically around the crisis, cells have 0 or 1 dicentric chromosomes, even some cells have more). As neo HTH telomeric motifs are rare events, decreasing G5 primer would decrease PCR detection efficiency. The same for G3 primer due to thermal stability.
In the last assay the presence of palindromic sequences in potential HTH telomeric motifs was tested with G5-PCR only.
Some of them generate palindromic sequences as GGCC cut by the isoschisomeres Hpa II / Msp I restriction endonucleases, or TTAA .There are 36 possible head-to-head telomeric motifs as follow:
 |
| Head-to-head telomeric motif generation by chromosomic fusion |
Some of them generate palindromic sequences as GGCC cut by the isoschisomeres Hpa II / Msp I restriction endonucleases, or TTAA .There are 36 possible head-to-head telomeric motifs as follow:
TTAGGG
|
TAGGGT
|
AGGGTT
|
GGGTTA
|
GGTTAG
|
GTTAGG
|
|
CCCTAA
|
TTAGGGCCCTAA
|
TAGGGTCCCTAA
|
AGGGTTCCCTAA
|
GGGTTACCCTAA
|
GGTTAGCCCTAA
|
GTTAGGCCCTAA
|
CCTAAC
|
TTAGGGCCTAAC
|
TAGGGTCCTAAC
|
AGGGTTCCTAAC
|
GGGTTACCTAAC
|
GGTTAGCCTAAC
|
GTTAGGCCTAAC
|
CTAACC
|
TTAGGGCTAACC
|
TAGGGTCTAACC
|
AGGGTTCTAACC
|
GGGTTACTAACC
|
GGTTAGCTAACC
|
GTTAGGCTAACC
|
TAACCC
|
TTAGGGTAACCC
|
TAGGGTTAACCC
|
AGGGTTTAACCC
|
GGGTTATAACCC
|
GGTTAGTAACCC
|
GTTAGGTAACCC
|
AACCCT
|
TTAGGGAACCCT
|
TAGGGTAACCCT
|
AGGGTTAACCCT
|
GGGTTAAACCCT
|
GGTTAGAACCCT
|
GTTAGGAACCCT
|
ACCCTA
|
TTAGGGACCCTA
|
TAGGGTACCCTA
|
AGGGTTACCCTA
|
GGGTTAACCCTA
|
GGTTAGACCCTA
|
GTTAGGACCCTA
|
If the telomeric fusion point contains a palindromic sequence, submitting the genomic DNA to endonuclease prior G5-PCR may prevent the PCR amplification:
 |
| Endonuclease digestion of DNA may prevent G-PCR amplification. |
In uncut DNA (primary fibroblasts (line 1), precrisis fibroblasts (line 6), immortalized clone (line 11)), G5-PCR produces two major bands bellow 1200 bp. Those bands vanished as DNA is cut with MspI (GGCC) or with an endonuclease targeting TTAA sequence (from left to right, primary cells, pre or post-crisis fibroblasts:lines 2, 4, 7,9, 12, 13), indicating that palindromic sequences exist between inverse tandem telomeric motifs.
When genomic DNA is cut with HpaII, an endonuclease cutting GGCC motifs free of methyl-cytosine, the G-PCR product cannot be distinguished from the uncut DNA (lines 3, 8, 13), indicating that the cytosines are methylated in/between inverse telomeric motifs.
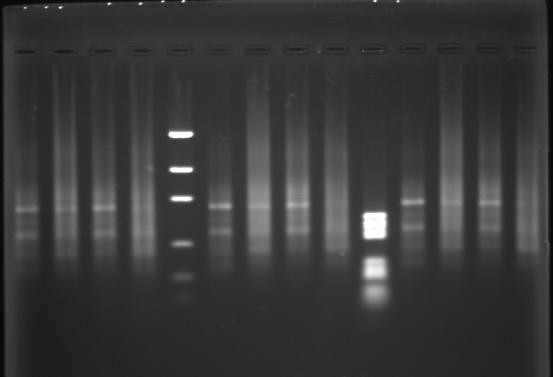 |
| G5-PCR following endonuclease cut (Agarose gel + EtBr).(well 1: primary fibroblast DNA (PF) uncut, well2: PF+MspI, well3: PF+HpaII, well4: PF+TTAA cut, well5: molecular weight markers (possibly :2176, 1766, 1230, 1033, 653, 517, 453 bp), well6: precrisis transformed (PT) fibroblast uncut, well7: PT+MspI,well8: PT+HapII, well9: PT+TTAA cut, well10: mw marker(?), well11: Immortalized postcrisis fibroblast (IF) uncut, well12: IF+MspI, well13: IF+HpaII, well14: IF+TTAA cut. |
If the aim was to detect somatic telomeric fusions associated to cellular senescence or to cellular transformation, the G5-PCR assays failed to distinguish clearly the different cell states. The G-PCR to detect end-to-end telomeric fusion may be optimized (PCR optimization) by increasing stringency:
- by increasing annealing T°
- by decreasing elongation time
- using hot-start PCR (Taq hot-start or wax)
Polyacrylamide gel electrophoresis (PAGE) with P32-labelled (TTAGGG)n primer instead of ethidium-bromide stained agarose gel to visualize PCR product, may detect somatic telomeric fusions in the range 0-600 bp. In the last example, the six last lines correspond to G-PCR products were visualized by PAGE (may be products corresponding to lines 6 to 11 in the second assay).
Real time PCR, in-situ PCR on nuclei could be also considered.
 |
| Six G5-PCR products (right side) in a PAGE+Ethidium Bromide staining |
 |
| Two kinds of sequences leading to bands in G-PCR product. |
This last hypothesis could be checked by FISH. The G-PCR product could be labelled (after a second round of PCR) with Fluo-dNTP and hybridized on metaphasic chromosomes. Three FISH conditions could be set:
- labelled G-PCR product alone: some locci should be detected.
- labelled G-PCR product+excess of Cot1 DNA: should compete satellite DNA. Detected locci should contain non satellite sequence, possibly telomeres or unique sequences.
- labelled G-PCR product+excess of unlabeled telomeric DNA (produced by PCR, Ijdo & al.): detected locci should not contain telomeric motifs.

Monday, December 19, 2011
Telomeres quantification in a nucleus
Telomeres quantification can be done at low magnification in interphasic cells. A microscopic field was recorded with a CCD camera at low magnification (objective x25). Nuclei were counterstained with DAPI and the telomeres were detected with a Cy3-PNA probe.
From the field image, a nucleus is segmented and the DAPI and Cy3 spectral components are isolated. Even at low magnification, the telomeric spots can be segmented as follow:

Background is removed by top-hat filtering with a small structuring element (a disk of size=5). The top-hat image is then submitted to a hmin operator, leaving the peaks higher than 200 gray level units, then regional maxima are found.

The regional maxima are labelled to obtain markers for the watershed algorithm. Once thresholded, the top hat image is converted into distance map using euclidian or chess-board distance without significant difference.
Watershed doesn't succeed very well in separating spots belonging to the lower cluster of three spots. It may be interesting to use a high pass filtered image to build a distance map.

The segmented spots can be overlaid to the original image (blue:telomeric spots, yellow:lines separating the spots after watershed). The quantification can be then performed on the original image (left) but the background must be estimated. The quantification can also be done on the Top-Hat filtered image where the background value is close to zero.
To quantify the spots, two parameters are measured: the spot area and the mean of the spot. The spot intensity is set to the product of the area by the mean gray level value (without taking the exposure time into account).

The area, mean and intensity values can be mapped onto an image or displayed as a histogram (from left to right: histogram of spots mean values, of spots area and histogram of spots intensity).
The following python script relies on pymorph, mahotas and scipy. It could be tested with skimage.
The following python script relies on pymorph, mahotas and scipy. It could be tested with skimage.
# -*- coding: utf-8 -*-
"""
Created on Fri Dec 16 13:14:14 2011

@author: Jean-Patrick Pommier
"""

import scipy.ndimage as nd
import pylab as plb
import numpy as np

import mahotas as mh
import pymorph as pm

import skimage as sk
import skimage.morphology as mo

def E_distanceTransform(bIm):
    #from pythonvision.org
    dist = nd.distance_transform_edt(bIm)
    dist = dist.max() - dist
    dist -= dist.min()
    dist = dist/float(dist.ptp()) * 255
    dist = dist.astype(np.uint8)
    return dist
def Chess_distanceTransform(bIm):
    #from pythonvision.org
    dist = nd.distance_transform_cdt(bIm,metric='chessboard')
    dist = dist.max() - dist
    dist -= dist.min()
    dist = dist/float(dist.ptp()) * 255
    dist = dist.astype(np.uint8)
    return dist

def gray12_to8(im):
    i=0.062271062*im
    return pm.to_uint8(i)

path="/home/claire/Applications/ImagesTest/JPP50/16/"
CC="DAPI/"
PR="CY3/"
im="1.TIF"

dapi=mh.imread(path+CC+im)
cy3=mh.imread(path+PR+im)
#==============================================================================
# Extracting known nuclei
#==============================================================================
nuc=dapi[215:264,1151:1198]
telo=cy3[215:264,1151:1198]
#==============================================================================
# Telomeres Segmentation with pymorph and ndimage
#==============================================================================
op=pm.open(telo,pm.sedisk(5))
top=telo-op
h=pm.hmin(top,200)
remax=pm.regmax(h)
blur=nd.gaussian_filter(h,3)
hi=h-1.0*blur
mask=np.copy(hi)
hi[mask<0]=0
remax=pm.edgeoff(remax)
markers,n=nd.label(remax)
print n," spots detected"
distE=E_distanceTransform(top>200)
distC=Chess_distanceTransform(top>200)
segE,L=pm.cwatershed(distE,markers,return_lines=True)
segC,L=pm.cwatershed(distC,markers,return_lines=True)

#==============================================================================
# Display segmentation on one nucleus
#==============================================================================
print 'display'
RedNuc=mh.bwperim((nuc>1000),n=4)
BlueSpot=mh.bwperim((segE>0),n=4)
GreenSpot=mh.bwperim((segC>0),n=4)


displayTelo=pm.overlay(gray12_to8(telo),red=RedNuc,blue=BlueSpot,yellow=L)
displayTeloC=pm.overlay(gray12_to8(top),red=RedNuc,green=GreenSpot)
#==============================================================================
# Quabtification
#==============================================================================
mean=pm.grain(top,segE,'mean','data')
print np.shape(mean)
area=pm.blob(segE,'area','data')
meanIm=pm.grain(top,segE,'mean','image')
areaIm=pm.blob(segE,'area','image')
print mean
plb.figure(1)
plb.subplot(141,frameon=False, xticks=[], yticks=[])
plb.title('raw 12bits')
plb.imshow(telo)
plb.subplot(142,frameon=False, xticks=[], yticks=[])
plb.title('top Hat')
plb.imshow(top)
plb.subplot(143,frameon=False, xticks=[], yticks=[])
plb.title('hmin')
plb.imshow(h)
plb.subplot(144,frameon=False, xticks=[], yticks=[])
plb.title('regional max')
plb.imshow(remax)

plb.figure(2)
plb.subplot(331,frameon=False, xticks=[], yticks=[])
plb.title('markers')
plb.imshow(markers)
plb.subplot(332,frameon=False, xticks=[], yticks=[])
plb.title('Thresholded Top-Hat')
plb.imshow(top>200)
plb.subplot(334,frameon=False, xticks=[], yticks=[])
plb.title('Euclid dist map ')
plb.imshow(distE)
plb.subplot(335,frameon=False, xticks=[], yticks=[])
plb.title('watershed seg')
plb.imshow(segE)
plb.subplot(333,frameon=False, xticks=[], yticks=[])
plb.title('TopH+hi pass')
plb.imshow(hi)
plb.subplot(337,frameon=False, xticks=[], yticks=[])
plb.title('Chess d map')
plb.imshow(distC)
plb.subplot(338,frameon=False, xticks=[], yticks=[])
plb.title('watershed Chess')
plb.imshow(segC)

plb.figure(3)
plb.subplot(121,frameon=False, xticks=[], yticks=[])
plb.title('telo+seg')
plb.imshow(displayTelo)
plb.subplot(122,frameon=False, xticks=[], yticks=[])
plb.title('telo+seg')
plb.imshow(displayTeloC)

plb.figure(4)
plb.subplot(231,frameon=False, xticks=[], yticks=[])
plb.title('Quant image=mean')
plb.imshow(meanIm)
plb.subplot(232,frameon=False, xticks=[], yticks=[])
plb.title('Quant img=area')
plb.imshow(areaIm)
plb.subplot(233,frameon=False, xticks=[], yticks=[])
plb.title('Quant img=mean*area')
plb.imshow(areaIm*meanIm)
plb.subplot(234)
plb.hist(mean)
plb.subplot(235)
plb.hist(area)
plb.subplot(236)
Q=areaIm*meanIm
plb.hist(Q.flatten()[Q.flatten()>0])
plb.show()
Tuesday, May 17, 2011
Highlighting Interstitial Telomeric Spots in interphasic cells (HITS-FISH)
Telomeric fusions underscore telomeric binding proteins disfunctions. Fusions occur in senescent cells between short telomeres, they are detected in metaphasic cells by dicentric chromosomes most generally with no telomeric spots at the fusion point.
In some SV40 transformed fibroblast cell line, interstitial telomeric spots (ITS) are as bright as terminal telomeric spots, this indicates some uncoupling between telomere lenght and their capacity to block telomeric fusions.
From metaphasic chromosomes observation, fusions retaining visible telomeric spots are rare events but may be more frequent in interphasic cells.
 |
| ITS observed in a precrisis human SV40 transformed cell line (Ducray et al., oncogene 1999) |
From metaphasic chromosomes observation, fusions retaining visible telomeric spots are rare events but may be more frequent in interphasic cells.
 |
| ITS from a SV40 transformed cell line |
Bal31 in-situ:
Several nucleases or DNA polymerases were used in assays requiring fixed material (chromosome banding+restriction endonuclease, in-situ nick translation, fluorescent labelling with TUNEL, in-situ PCR). The exonuclease Bal31 removes totally terminal telomeric sequences of naked DNA after some hours of digestion (R C Allshire, M Dempster, and N D Hastie, NAR 1989; de Lange et al, MCB 1990) . In-situ, the terminal telomeric sequences, should be removed by Bal31 digestion. If telomeric spots can be detected in nuclei after Bal31 digestion, those spots should be ITS. Monitoring ITS may be a tool of interest to probe telesome functions at the scale of unique cell, or to monitor the state of a tissue.Pig cells as model cells?
On human metaphasic chromosomes, a bright ITS indicates an abnormal cell but for cheaper DAPI stained chromosomes rearrangements too. Normal pig karyotype shows interstitial telomeric spots:
 |
| Normal diploid pig metaphase with a chromosomes pair having ITS. |
After QFISH on interphasic pig nuclei, there are two ITS of same magnitude than terminal spots, these two pig ITS remain hidden in the forest of terminal telomeric spots:
 |
| Pig nuclei (25x magnification) |
Some conditions of Bal31 digestion should retain these two ITS and remove totally terminal telomeric spots yielding the possibility to observe telomeric fusions in nuclei.
Assay:
Tuning the conditions of Bal31 digestion is a prerequisite step. Supposing that the exonuclease Bal31 can remove terminal sequence from fixed material, when this enzyme is usually used to digest purified DNA in solution.

If pig cells are not available, performing Bal31 digestion on control human cells such lymphocytes should tell if Bal31 can remove telomeres in-situ.
From conventionnal cytogenetic preparation of pig cells (fibroblasts,lymphocytes), digestion time, numbers of Bal31 units could be set up as follow :
 |
| Possible protocol for HITS FISH |
The protocol modified from Lansdorp et al. (Hum Mol Genet. 1996 May;5(5):685-91.) could be also adapted to liquid hybridization for flow FISH. Under optimal conditions pig cells could be used as internal control for Bal 31 digestion by mixing human and pig cells in the same cytogenetic preparation (9:1 ratio).

Human cells can be then distinguished from pig cells with an additionnal oligo probe. In the following example (25x magnification), simultaneous hybridization with Cy3-PNA-(CCCTAA)3 (displayed in green) and Cy5-DNA (displayed in red) oligo probe was performed (unpublished data):

Candidate cells to test the assay, may be SV40 precrisis cells with highly rearranged chromosomes and numerous dicentrics, or better cells with controlled mutations.
Subscribe to:
Posts (Atom)