Telomeres: structure and functions
If it is necessary to explain what the telomeres are, let's watch some lectures:
First from Elisabeth Blackburn:
Or from Titia de Lange:
Modeling Telomere Dynamic:
Levy et al. in Telomere End-replication Problem and Cell Aging, modeled the distribution of telomeric erosion with cells divisions at a single telomere. The model accounts for the decrease in somatic cell division capabilities with in-vitro passages of fibroblasts (Hayflick's limit).
Here, the telomere length of several chromosomes is modeled numerically with segregation of chromosomes in daughter cells. The model takes the 5' degradation of the CCCTAA strand into account. The aim of the simulation is to compare the distributions with QFISH data. The model shows that the telomeres length at pter and qter are correlated for a given homologous chromosome. It can be used to derive statistical tests to detect telomere length difference between homologous chromosomes.
Code Installation
Download several python modules and the jupyter notebook in the same directory:
- WatsonCrick.py
- ClassChromosome.py
- Genome.py
- Cellular.py
- telomere-length-distribution-in-synchronous-dividing-cells-ipynb
Some unit tests can be run, a jupyter notebook is available (see the link to gist), they yield:
Model structure:
The model consists in a class Cell which have a Genome, which have chromosomes, which have two complementary single strands DNA (Watson/Crick). Each strand has two telomeres.
A single strand object can be instantiated as follow:
A chromosome object is instantiated with two complementary Watson/Crick strands:
For example, two chromosomes, rosalind and franklin can be instantiated as follow:
A single chromatid chromosome, in the G1 state of the cell cycle, can be triggered to the G2 state:
After a round of DNA replication, 5' CCCTAA motifs are incompletely
replicated and TTAGGG 3' can be randomly degraded, leading to shorter
telomeres on metaphasic chromosomes on both chromatids at pter and qter. Iin the G2 state a chromosome has two chromatids, the length of a
telomere on a given arm (pter ou qter) is given by two values:
The mitosis is triggered by chromosome segregation:
The ros chromosome object keeps its signature before and after the mitosis:
 |
| Signature of the ros chromosome in the G2 state before mitosis |
Definition of a Genome object:
It is convenient to define a genome object, it is instantiated for example with two chromosomes (2N=2):
The genome state (G1/G2), the chromosomes of the genome can be accessed to read the telomere length (CCCTAA or TTAGGG motifs), the length difference between homologous telomeres:
Cell object has a genome:
 |
| Unit test results for Cell object |
Once a single genome object is instantiated, a single cell object can be instantiated. Let's build a cell with 2N=10:
The length of the telomeres (bp) in that single cell can be read from a pandas dataframe:
Let's allow 10 synchronous cellular divisions from 1 cell to 1024 cells. Then as for fibroblasts cultures, let's make passages, that is one allows only half randomly chosen cells to divide once:
Results
The envelope of the telomere length distribution at a single telomere after 14 divisions (10 divisions + 4 passages) seems to be gaussian:
Correlation between the length at pter and qter on the same homolog
The length of the telomeres (pter, qter) of the same homologous chromosome (the maternal one for example) are correlated:
It is possible to plot the telomeres length of two homologous chromosomes:
The length of the telomeres belonging to different homologous are not correlated.
Let's plot the length of the telomere from the paternal chromosome 1 at qter as a function of the length of the telomere at 1qter on the maternal homolog:Mean telomere length in synchronous dividing cells population:
In telomerase negative cells as modeled here, the telomere length decreases with cells divisions.
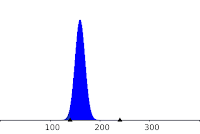
The decrease of telomere length depends on the 5' exonuclease
activity. The amount of degraded DNA is modeled here by random variable, X, following a binomial law
(N=400, p=0.4) :
to fit the data of Makarov et al. (1997) as follow:
 |
| Distribution of X: P(130<X<200)=0.999 |
The expected value of X, the deletion length, is :
160 +20 bp
As published in 1992, the
standard deviation of the telomere length increase at each cell
division.
So the mean telomere length, , was plotted as a function of the cell divisions after an expansion of ten cellular divisions and four passages.
The mean telomere length decreases by 90 bp/div
and the heterogeneity increases:
At each passage the length of each telomere (column) of each cell (row) of the simulation is copied in a pandas data-frame, for example at passage P4:
Then the mean telomere length in the whole cells population can be calculated:
Using seaborn, the telomere length of some homologs can be compared:
Population of Mixed Cells
Cells from different passages can be mixed, for example in equal proportions. The correlation between pter and qter of a given homolog should start to vanish:
Senescence in-silico:
Short telomeres trigger an irreversible transition to state of the cell cycle (senescence). Let's take a cells population, make successive passages. Initial cells population is expended from one cell (telomerase off) after eight divisions. The genome of the initial cell is instantiated with 2N=4 and with the length of the shortest telomere set to 2000 bp.
At each passage, it's possible to count the cells in the state or to calculate the confluence of the cells population. The threshold telomere length triggering the G0 state is set arbitrarily to 200 bp. The initial population is passed 20 times:
The confluence is calculated as the number of cells at a given passage by the initial number of cells. With the shortest initial telomere length set to 2000 bp, the confluence reach 50% after 18 doublings:
 |
| Senescence in silico: confluence (100 N cell/ N initial cells) decreases with cells divisions |


